Despite having access to a growing pool of sales data, our client struggled to translate that information into actionable insights. The challenges weren’t about data scarcity but rather about using their industry datasets for better planning.
Sales data was being analyzed manually, making it difficult to identify seasonality patterns and trends across different geographies and periods.
The client couldn’t easily track or compare how different SKUs and packaging formats were performing, which limited their ability to optimize offerings or adjust go-to-market strategies.
They had limited visibility into how sales were playing out at the regional, distributor, or retail level, resulting in reactive rather than data-driven, proactive planning.
With sales data growing rapidly, there was no streamlined way to visualize or interpret patterns at scale, making reporting and forecasting increasingly inefficient.
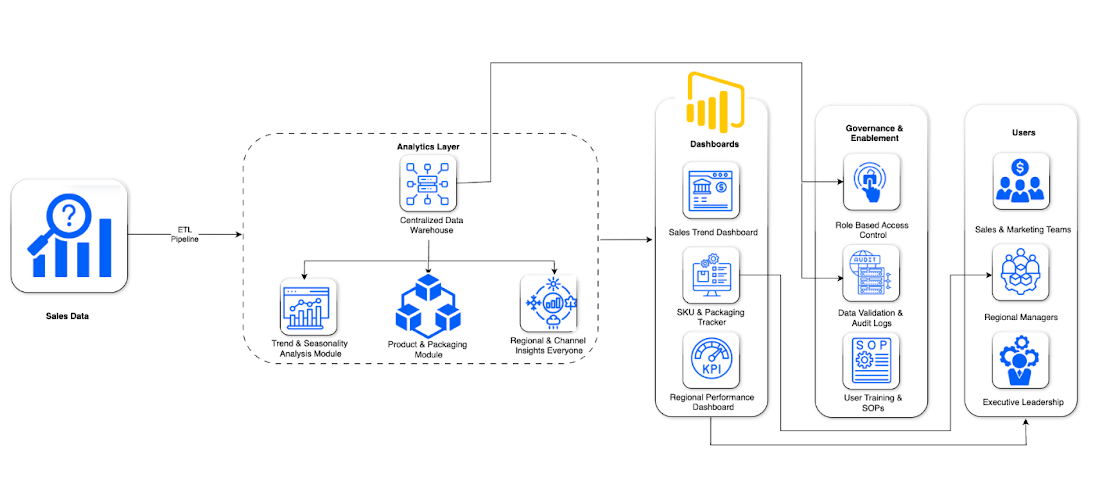
For thw solution, we teamed up to build a comprehensive, business-ready analytics solution. The focus was not just on technology, but on usability, speed, and scalable impact.
We began by structuring their historical sales data with robust data models, using Power BI and advanced Excel modeling to uncover granular insights, right down to individual SKUs and channels.
Our team designed intuitive dashboards that helped the client explore trends, seasonal patterns, and geographic performance. With drill-downs and dynamic filters, business teams could now slice and dice the data any way they needed, without technical support.
To support smarter inventory and marketing decisions, we built dashboards that compared the performance of different products and packaging types, complete with benchmark indicators for quick evaluations.
We brought in regional, distributor, and retail-level views, enabling both real-time monitoring and historical analysis. This gave the client a 360° lens into their sales funnel, helping them act faster and more proactively.
The final setup featured an intuitive UI and role-based data access, so different teams, from regional sales to C-level execs, could align quickly, spot issues early, and act with clarity.
We brought all the client’s sales data into one clean, centralized model, eliminating silos. To reveal trends, we used time-series decomposition and DAX calculations to surface seasonality and performance shifts.
Using Power BI, we built interactive dashboards with filters by region, distributor, product line, and channel. We also added a packaging-level view so the team could analyze sales patterns and profitability by format, bottles vs. cans, etc., with just a few clicks.
To keep data secure, we applied row-level security (RLS) and role-based access controls (RBAC). We also provided hands-on training and SOPs, so internal teams could confidently explore insights and use the system independently.
With advanced modeling and visual exploration, the client could now detect seasonality and shifting sales patterns 3x faster, cutting analysis time by over 70%. This meant less waiting and quicker responses to real market shifts.
By tracking SKUs and packaging types in detail, the client fine-tuned demand forecasting and planning. This sharper visibility led to a 20% improvement in strategy alignment between production, inventory, and actual demand.
The dashboards gave leaders a 360° view, with performance broken down across 10+ distribution zones and 30+ retail partners. Decision-making moved from generic to hyper-local, and from reactive to proactive.
Thanks to intuitive, self-service dashboards, even non-tech users can now generate insights without waiting on IT. This shift cut reporting turnaround time by 50%, freeing up analysts and improving daily operational agility.
With improvised sales intelligence, DataToBiz helped the client to drive sharper product strategies, streamline operations, and respond faster to market shifts, marking a measurable impact in the beverage industry in the UAE.
Food and Beverages
Middle East
End to End Project Lifecycle Management
Briefly describe the challenges you’re facing, and we’ll offer relevant insights, resources, or a quote.

Business Development Head
Discussing Tailored Business Solutions
DataToBiz is a Data Science, AI, and BI Consulting Firm that helps Startups, SMBs and Enterprises achieve their future vision of sustainable growth.
DataToBiz is a Data Science, AI, and BI Consulting Firm that helps Startups, SMBs and Enterprises achieve their future vision of sustainable growth.