

The finance team had been relying on multiple standalone Excel spreadsheets for reporting across different regions. While Excel offered flexibility, managing complex, growing reporting needs became increasingly difficult.
Manual Data Errors
Combining data from various spreadsheets led to errors, duplication, and inconsistencies, slowing down reporting and analysis.
Weak Reporting Cycles
Reconciling and validating data required significant manual effort, delaying timely insights for decision-making.
Limited Visibility
Tracking budget versus actuals and monitoring profitability trends was cumbersome, making it hard to respond quickly to financial developments.
Governance and Version Control Issues
Multiple file versions circulated among stakeholders, creating confusion and increasing the risk of mistakes.
Security Gaps
Sensitive financial data was shared without proper role-based access controls, raising compliance and security concerns.
We worked with the client to design and implement a centralized Power BI dashboard that could bring all financial reporting into one place.
Data Convergence
All financial data, including budgets, estimates, and actuals, was brought together under a single analysis system, reducing reliance on multiple spreadsheets and minimizing errors.
Interactive Reporting
The dashboard included interactive visuals, such as variance analysis, KPIs, and trend lines, giving finance teams a clear, live view of performance across regions.
Automated Refresh & Version Control
Data refreshes were automated, and version control was built in, eliminating manual reconciliation, speeding up reporting cycles, and ensuring everyone worked from the same accurate data.
Secure Access
Role-based access was implemented, so different financial stakeholders could view or interact with reports according to their responsibilities, improving security and compliance.
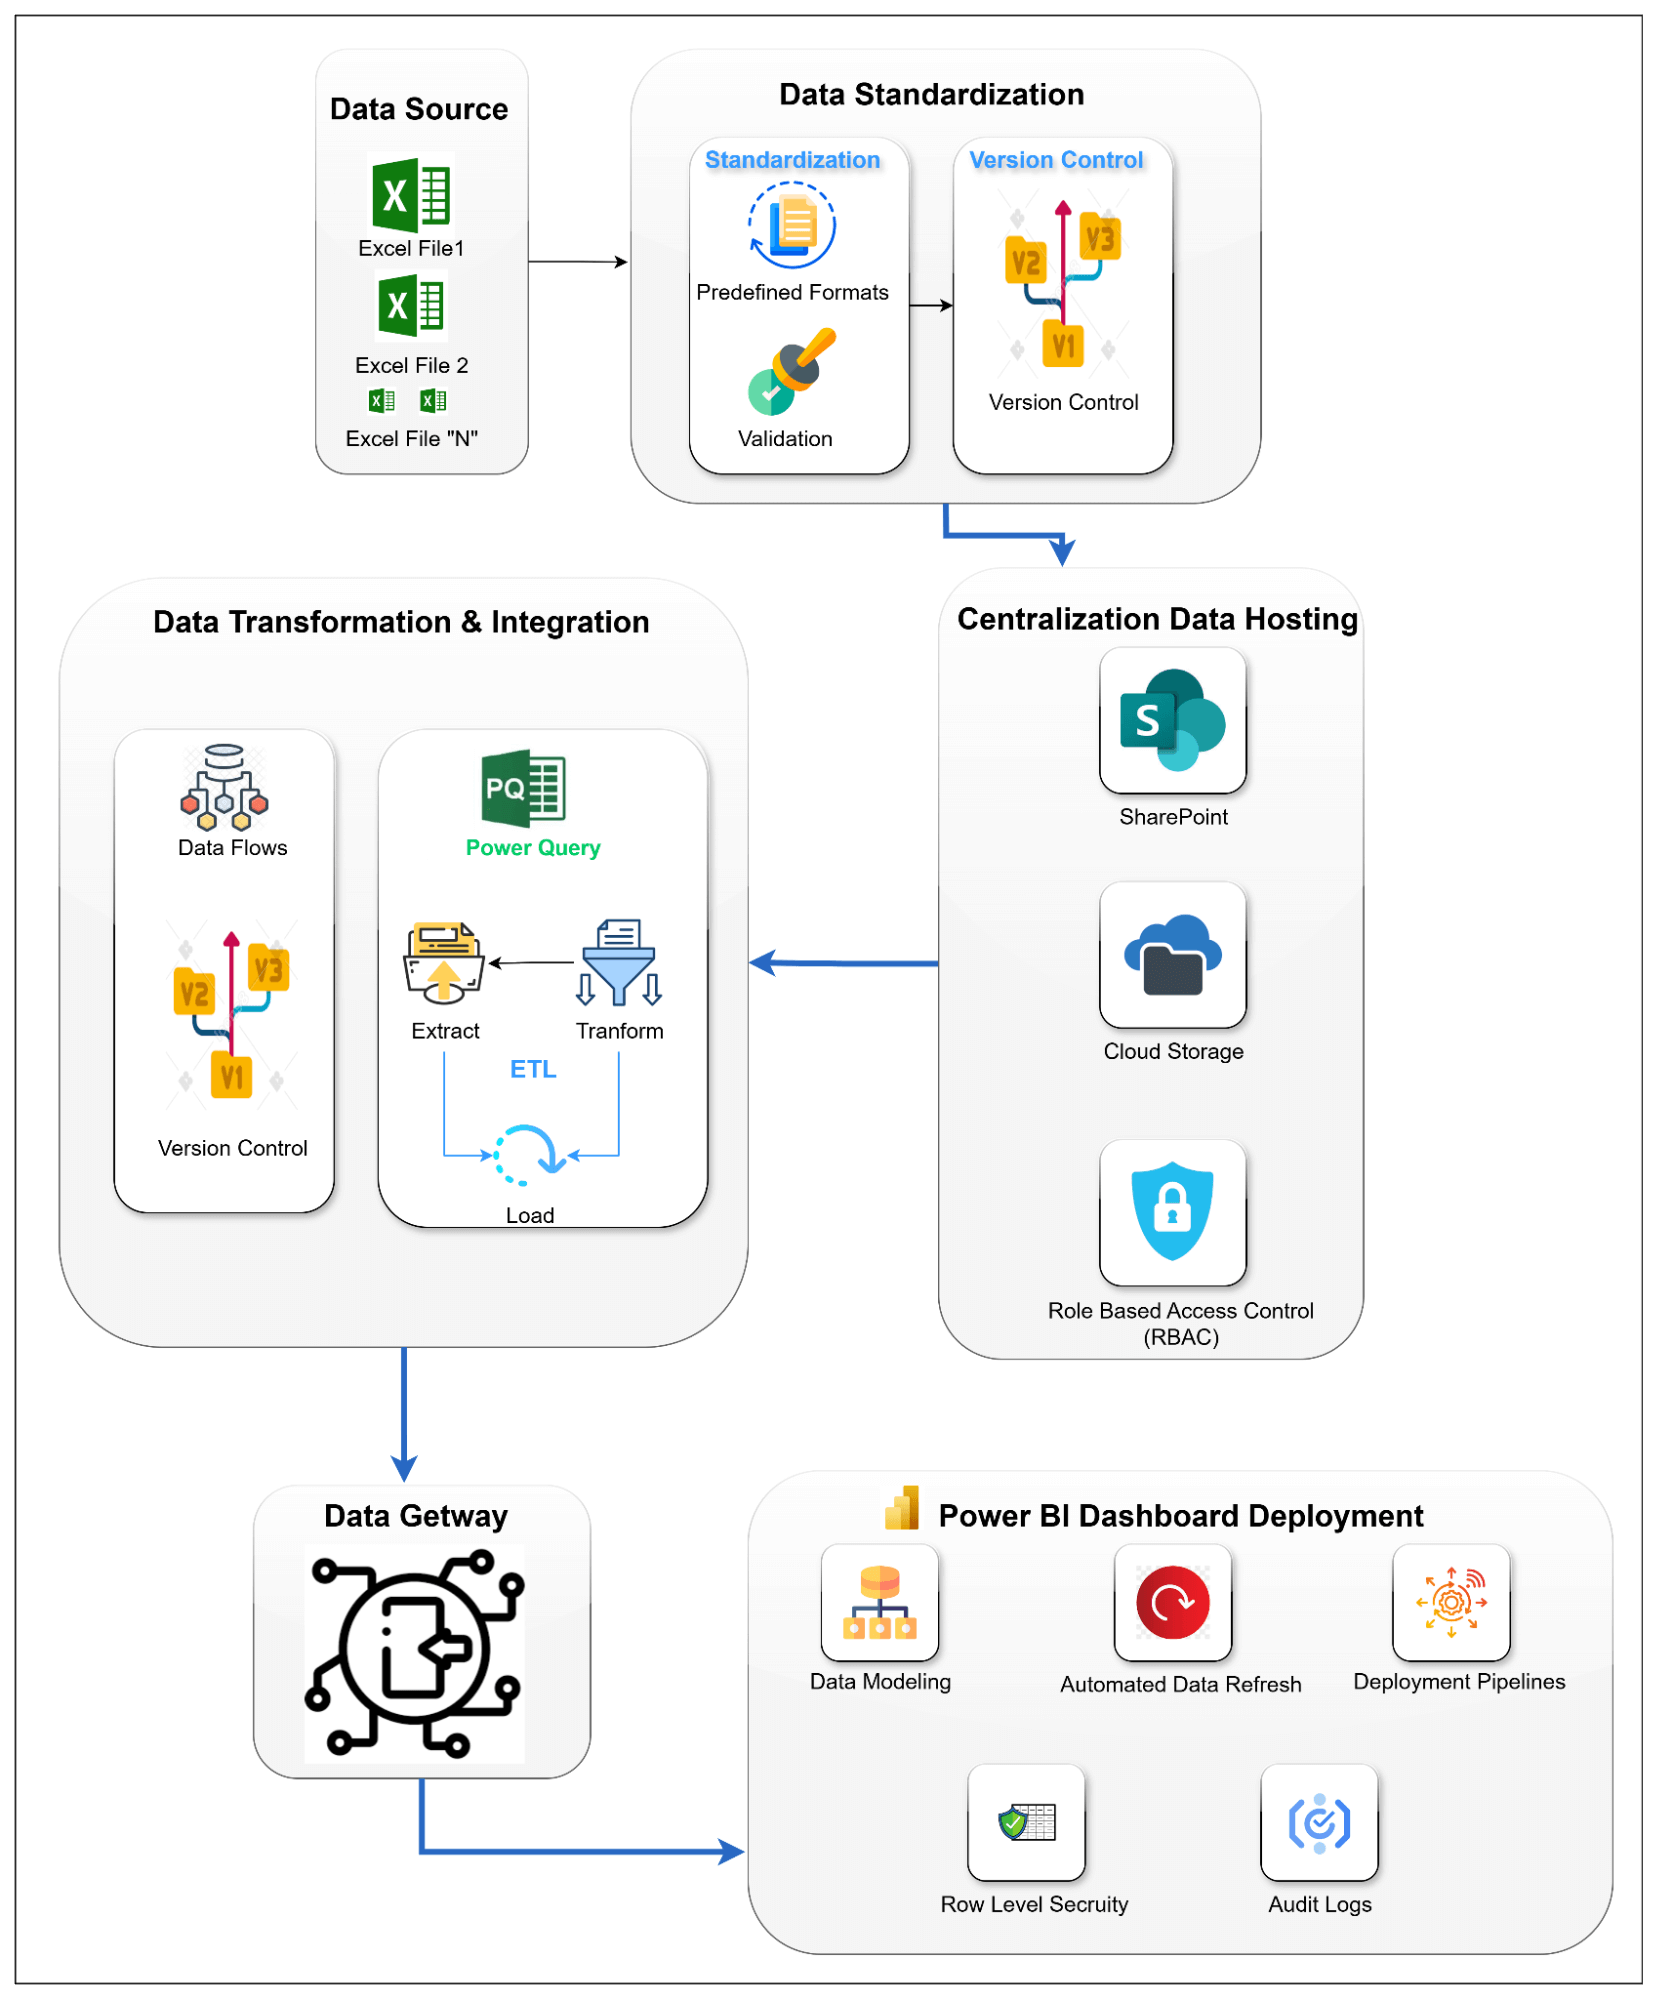
Data Sources: Multiple Excel files with budget, cost, and revenue data integrated.
Data Standardization: Predefined formats, validation checks, and version control ensured consistent data.
Data Transformation & Integration: Power Query used for ETL, with dataflows managing integration and versions.
Centralized Hosting & Security: Financial datasets stored in SharePoint/Cloud with role-based access controls and secure Data Gateway connectivity.
Power BI Deployment: Hybrid data modeling, automated refreshes, row-level security, deployment pipelines, and audit logs for governance.
Cloud & DevOps: Dockerized services with CI/CD pipelines, monitored via Prometheus and Sentry.
Improved Accuracy
Consolidating all financial data into a centralized, governed platform cut manual spreadsheet errors by nearly 95%, ensuring more reliable reporting.
Faster Reporting
Automated refresh cycles and standardized workflows reduced reporting time by around 60%, letting the finance team focus on analysis rather than manual consolidation.
Stronger Governance & Security
Role-based access and version control ensured compliance and protected sensitive financial data across regions.
Better Stakeholder Visibility
Interactive dashboards provided real-time insights, improving reporting speed by roughly 70% and enabling easy tracking of KPIs and variance analysis.
Scalable & Future-Ready
The flexible data model and dashboard design prepared the system for regional expansion and future enhancements, including potential integration of AI-driven analytics.
For the client, the Power BI dashboard centralized complicated financial data across regions, giving teams clear visibility into budgets, costs, and profitability. The solution also established a scalable, secure framework to support ongoing reporting needs in a high-stakes, compliant industry.
Transportation & Logistics
UK
Managed Analytics
Briefly describe the challenges you’re facing, and we’ll offer relevant insights, resources, or a quote.

Business Development Head
Discussing Tailored Business Solutions

DataToBiz is a Data Science, AI, and BI Consulting Firm that helps Startups, SMBs and Enterprises achieve their future vision of sustainable growth.
DataToBiz is a Data Science, AI, and BI Consulting Firm that helps Startups, SMBs and Enterprises achieve their future vision of sustainable growth.