The client kept facing operational and analytical hurdles simply because their data was scattered across different systems, making it hard to get a clear picture of what was really happening.
Siloed Data Streams:
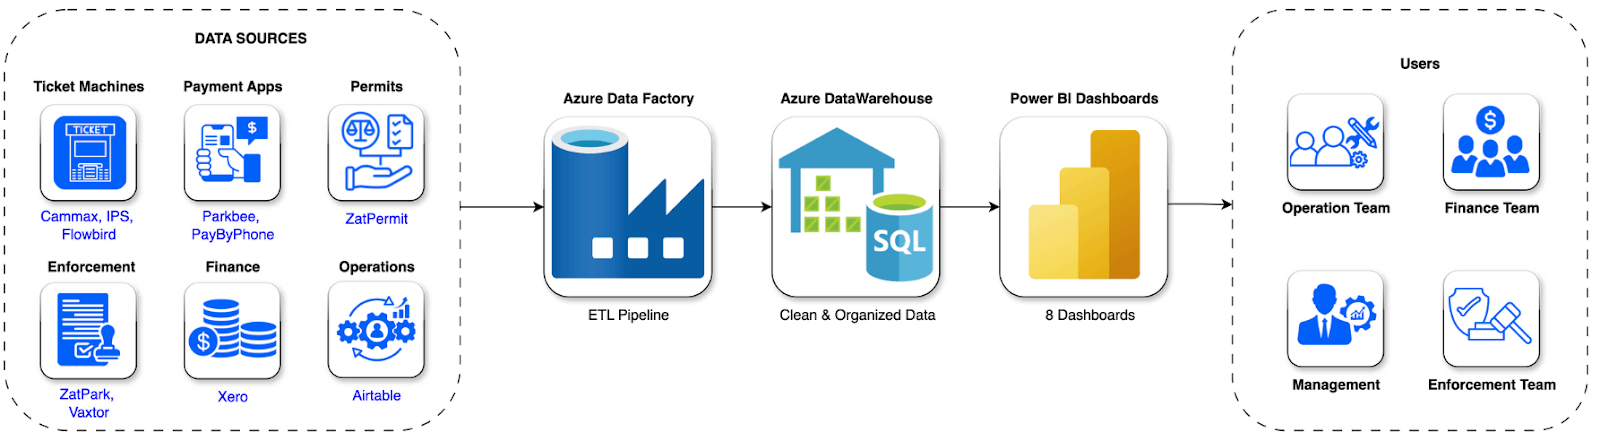
Data from ticket machines, payment apps, ANPR tools, and finance software lived in separate systems. This made it difficult to get a clear and connected picture of daily operations.
Delayed Insights:
Without real-time dashboards, teams often spotted revenue leakages, occupancy gaps or enforcement trends much later than they should have.
Limited Predictive Capability:
With no forecasting tools in place, decisions around pricing, capacity planning and enforcement were mostly reactive rather than informed.
Inefficient Reporting:
Most reports were built manually in spreadsheets, leaving plenty of room for errors and taking up time that could have been better spent on operations.
No Exception Alerts:
Important issues such as unpaid stays or unusually low occupancy went unnoticed until they had already caused revenue loss.
We arrived at a common point of creating a data infrastructure that brought all critical data into one place, streamlined reporting, and empowered teams with actionable insights to make faster, more confident decisions.
Data Integration and Preparation:
We built a centralized data integration platform to unify a wide range of sources, including Cammax, IPS, Flowbird, Parkbee, PayByPhone, ZatPermit, ZatPark, Vaxtor’s Helix, Xero, Airtable, Freshdesk, and Yext, using both APIs and scheduled CSV ingestions. Azure Data Factory pipelines handled data cleaning, standardization, and merging into a single Azure Data Warehouse, with incremental loading ensuring the information stays updated almost in real-time.
Augmented Analytics Layer:
Power BI dashboards were designed with intuitive drill-downs, easy filters, and full mobile access so teams could explore their data wherever they were. The analytics layer also included forecasting tools for occupancy, revenue, and permit trends, along with heat maps, seasonal patterns, and anomaly detection to help managers act before issues escalated.
Predictive Modeling:
Predictive models used historical behaviour and seasonal shifts to forecast both revenue and occupancy. They also estimated enforcement needs and permit usage, helping teams plan staffing, pricing, and resource allocation with greater confidence.
Governance and Access Control:
Role-based access ensured every department saw the data that mattered to them and nothing more. All information was encrypted in transit and at rest, supported by Single Sign-On for secure user access and full compliance with GDPR and relevant industry standards.
User Enablement and Adoption:
Workshops with stakeholders helped clarify key metrics and validate dashboard designs. Teams across operations, finance, and enforcement received hands-on training so they could use the new tools comfortably and make data-driven decisions from day one.
Cloud Infrastructure and Security:
The solution runs on Microsoft Azure, giving the client a secure and scalable foundation that meets industry compliance needs. Azure Key Vault protects all credentials, while Azure Monitor keeps a close watch on system health and activity.
Data Ingestion and Storage:
All incoming data flows into Azure Data Lake and Azure SQL Warehouse, organised through a clear star schema, so information stays structured and easy to work with.
Data Processing and Modeling:
Azure Data Factory handles the movement and transformation of data, preparing clean and consistent datasets. These feed into semantic models that power insightful and reliable reporting in Power BI.
Visualization and Insights Delivery:
The reporting layer includes 9 dashboard categories covering 48 key performance indicators. These span revenue, occupancy, channel performance, PCN insights, operational efficiency, growth, customer behaviour, customer experience, and sustainability, giving every team a full picture of their operations.
Monitoring and Governance:
Data lineage is tracked end to end, refreshes run automatically, and audit logs keep the environment transparent and well governed.
Reduced Reporting Time:
Reporting time dropped by nearly 70 %, with insights now ready in minutes instead of taking days.
Increased efficiency:
Operational efficiency improved as teams could quickly spot issues such as machine downtime, unpaid stays, and emerging low occupancy patterns.
Better decision making:
Decision-making became far more confident and informed, supported by predictive analytics that guided pricing and capacity planning.
Increased revenue capital:
Revenue capture increased through timely alerts that helped reduce losses from enforcement gaps.
Higher Data Accessibility:
Data became much more accessible, giving non-technical teams the ability to explore information on their own through easy, self-service dashboards.
By bringing all data into one place and giving the client real-time dashboards they could trust, DataToBiz helped shift their operations from reacting to issues to anticipating them. Teams could see what was happening across sites instantly, understand where attention was needed, and make decisions with far more confidence. This reduced the long delays that once slowed down revenue protection and day-to-day operations.
Technology & Software
UK
End to End Project Lifecycle Management
Briefly describe the challenges you’re facing, and we’ll offer relevant insights, resources, or a quote.

Business Development Head
Discussing Tailored Business Solutions
DataToBiz is a Data Science, AI, and BI Consulting Firm that helps Startups, SMBs and Enterprises achieve their future vision of sustainable growth.
DataToBiz is a Data Science, AI, and BI Consulting Firm that helps Startups, SMBs and Enterprises achieve their future vision of sustainable growth.